I’m completely new to Grafana, how do I get requests per second? But also, all the api calls go over websocket, requests per second will really just show when static files are loaded, which isn’t that important.
I’m using influxdb and telegraf, it has none of those. Guess I could give you access to Grafana if you’re interested in playing around with the configuration.


No idea, maybe it has something to do with websockets.
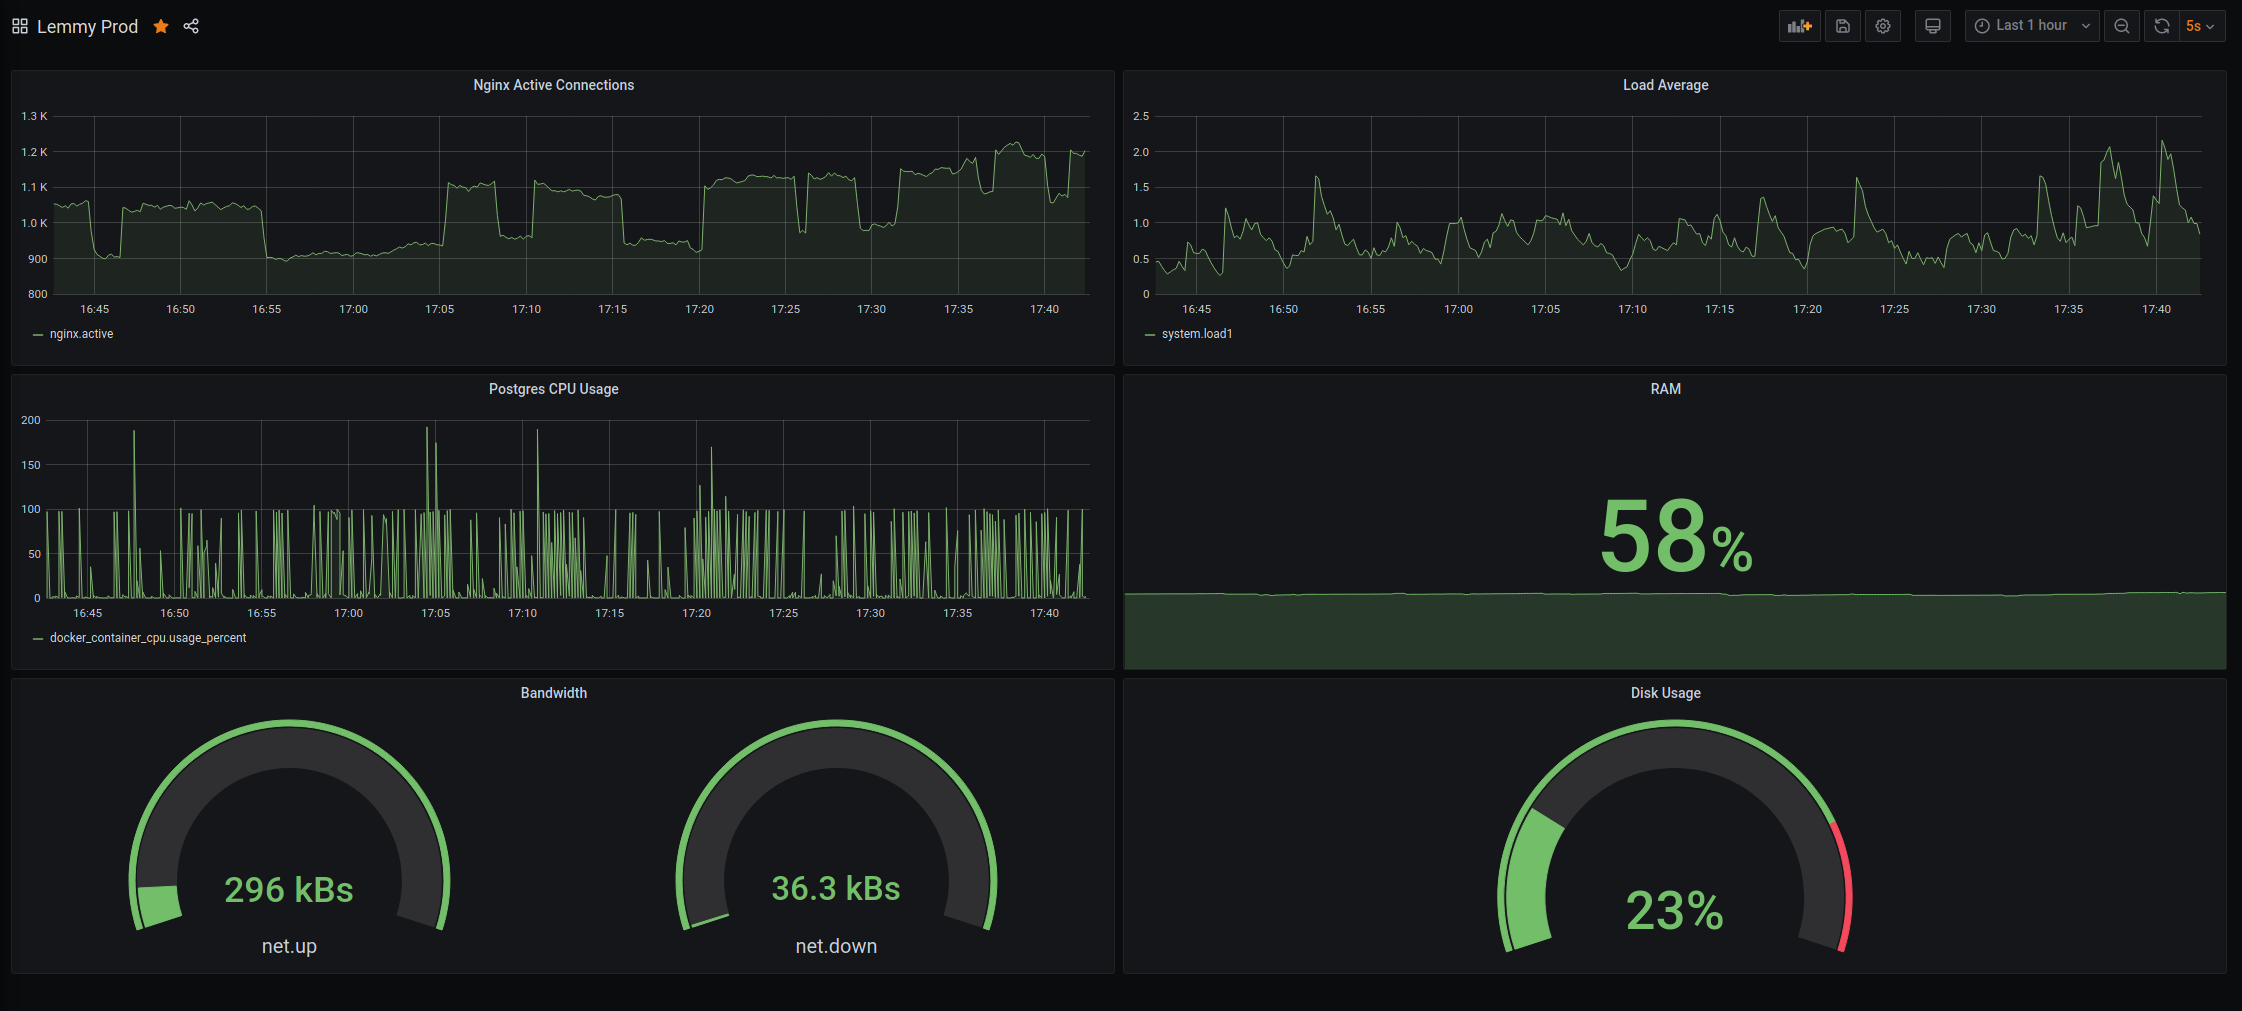
Nice, Grafana is just awesome!
You might want to check the number of requests/s (instead of active-connections) in Nginx - seems to be more meaningful to me.
I’m completely new to Grafana, how do I get requests per second? But also, all the api calls go over websocket, requests per second will really just show when static files are loaded, which isn’t that important.
Maybe nginx has a stat for data transferred over websockets? Otherwise I guess active connection count makes most sense.
Depends on your datasource. e.g. Netdata exports several metrics for prometheus:
I’m using influxdb and telegraf, it has none of those. Guess I could give you access to Grafana if you’re interested in playing around with the configuration.
@Aeolun@lemmy.ml