nutomicA to Sysadmin · 5 years agoGrafana is cool (this is dev.lemmy.ml)imagemessage-square7fedilinkarrow-up121arrow-down10
arrow-up121arrow-down1imageGrafana is cool (this is dev.lemmy.ml)nutomicA to Sysadmin · 5 years agomessage-square7fedilink
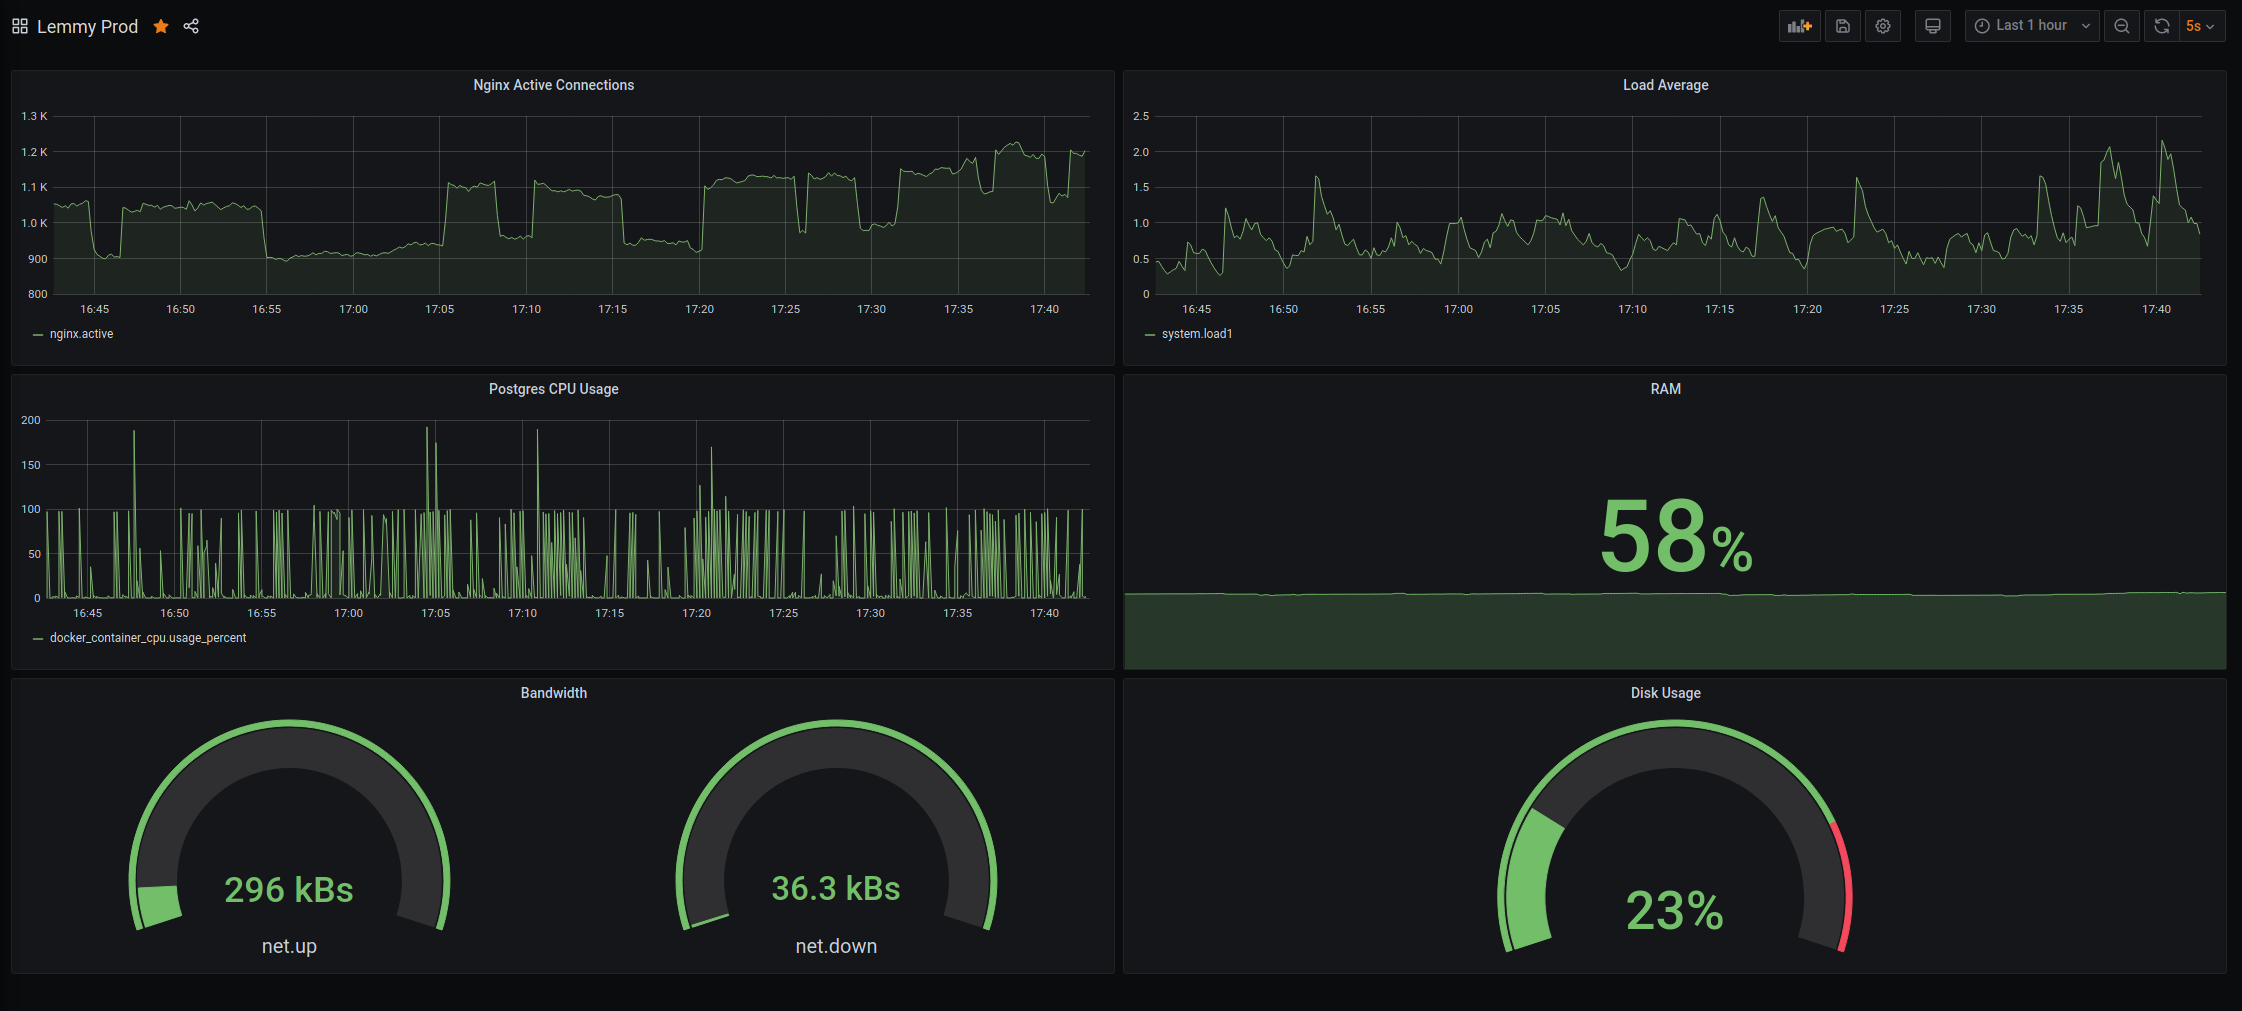
minus-squarepfuenderlinkfedilinkarrow-up3·5 years agoDepends on your datasource. e.g. Netdata exports several metrics for prometheus: netdata_netdata_pythond_runtime_ms_average netdata_nginx_connections_connections_average netdata_nginx_connection_status_connections_average netdata_nginx_connect_rate_connections_persec_average netdata_nginx_requests_requests_persec_average netdata_services_mem_usage_MiB_average
minus-squarenutomicOPAlinkfedilinkarrow-up1·5 years agoI’m using influxdb and telegraf, it has none of those. Guess I could give you access to Grafana if you’re interested in playing around with the configuration. @Aeolun@lemmy.ml


Depends on your datasource. e.g. Netdata exports several metrics for prometheus:
I’m using influxdb and telegraf, it has none of those. Guess I could give you access to Grafana if you’re interested in playing around with the configuration.
@Aeolun@lemmy.ml