Agreed. Moreover, I’d like some more insight in the consumer patterns of Gen Z. A pie chart would be nice including groups like eduction, healthcare, subscription services, entertainment, etc.
I have a feeling, without the data, that a lot of young people are spending way more on novelty and entertainment things than ever before while they’re complaining about not being able to afford things.
IDK why, but this reads like just about what every generation says about a younger generation: bad decisions, worse with money etc.
Even if Gen z were spending a larger percent of their income on luxury items, I’m certain it pales in comparison so their lower average income and higher average housing costs.
Your previous comment really reads as “Kids these days can’t afford housing, too busy with their avocado toasts and Netflixes” which is the likely reason for all the downvotes.
I can’t fix people’s narratives. I’m asking for data to illustrate the measurable impact of the economy on people’s personal finance and leisure over the decades.
For one example, to compare 2020 to 1960, what is considered “leisure”, what does that cost, and what percentage of a person’s income is spent on it. I’m not really interested in polls where “Gen Z says they’re struggling to afford a car” because that’s subjective and relative. It’s not at all about questioning their anecdotes; I’m curious what the graph or pie chart looks like over the decades.
I think, and am asking for something to prove me right or wrong simply because I’m curious, that there’s more leisure and luxury available to all people today than ever before. And I feel pretty strongly that the culture of consumerism has grown much stronger over the past 30-50 years making everyone feel like they need to spend more than they were in the first half of the last century.
Productivity Purchasing Power in The United States peaked in the '70s late '60s. The country’s overall productivity sucks today [see below comments]. I believe the numbers show that we’re all spending more of our income than we ever have before. And for those “earning” a salary based on archaic values set decades ago, it’s certainly logical they’d be most hurt by the culture of consumerism that’s so rampant today.
Also, I’d be very interested to compare the graphs to credit card debt over time. It’s too easy to click a button on our phones now to have something charged to a card without the stress of seeing it coming directly out of our checking account. This use of technology, I think, is a real factory for younger people who haven’t grown up learning how to balance a checkbook or the need to save real cash money to make major purchases. The success of services like Mint and Acorn and Chime indicate this isn’t my imagination.
No one likes when someone says your opinion is irrelevant when they’re asking for tangible numbers. I’m well aware that the economy is harder for young adults today. I’m also well aware that most people on the internet are ultra-sensitive and lack reading comprehension. There’s a large segment of the internet that can’t be bothered to read more than headlines and watch ten second TikTok videos. I know younger people aren’t the only ones guilty of this, but I have doubts they’re not the primary culprits.
Productivity in The United States peaked in the '70s
I really did want to take your comments in good faith but asking for data and then turning around to say something completely and blatantly false (and easily verifiable) is making that hard.
Yeah sure, there’s more leisure-type purchases available to us than ever before, and technology does make transactions ridiculously easy. However, the current economic situation for young adults is much too dire to attribute entirely to individual factors when clearly this is an issue on a societal scale.
I have a hard time understanding how you can present this information (people working harder and longer for less purchasing power than before) and arrive at the conclusion that young adults’ personal spending habits are to blame. The system is clearly engineered to keep the majority poor and enrich a tiny minority.
Want to know where the profits from the increase in productivity went instead of worker’s wages? I suggest looking up CEO wages from the '50s to the present day, and compare with the chart from my previous comment.
Everything I’ve seen has said that Millenials and younger are spending more on experiences and less on things, but also that their purchasing power is much weaker than their parents’ was at the same age. Millenials, I think, have about half the purchasing power as the Baby Boomers did in their 30s and 40s.
Also of note that I just saw the other day is that the price of cars has jumped up about 30% since 2021.
So, not exactly what you’re looking for, but some of the stuff I’ve seen/heard that probably plays contributing factors to this.
I think being priced out of the housing market influences a lot how likely you are to spend your money on experiences. It seems like that’s all young people can afford, the mortgages these days are daunting even for people much older in good positions.
Good info. Yeah, I’m just curious to see a clear comparison laid out. I think being able to literally visualize it would be more conducive to the ongoing conversation. Tough to trust what one cohort on the internet says about their personal experience. Seems like everyone online is broke yet increasing interest rates tell another story about the market overall.
Yeah, unfortunately, I don’t think one really exists. I’m sure there are people who have done the research, but you’re probably not likely to find the info laid out like that in a major news article or something. There’s also a major generational divide in terms of wealth and a disparity between the rich and poor in the US that’s been described as being comparable to the conditions just before the French Revolution, when a loaf of bread cost the same as the average worker made in a day, so looking at market forces like interest rates and such can paint a very different picture from what the average person is experiencing because of how weighted the averages are by the wealthy.
About a month ago, I watched an unrelated video that happened to have some very well researched info in it on the economic situation of Millenials called The Perpetual Infantilisation of Millennial Women. Great video that I pulled some of the info from for a similar conversation. It’s definitely worth the watch for that info alone. Some of the stuff I remember are things like 43% of Millennials own homes, well below the average of 65% per generation. And of those who don’t own a home, 52% aren’t saving for a house, often citing reasons like poor wages or joblessness, showing that many aren’t buying homes not because they’re buying them later than previous generations, but because for many the idea of owning a home straight up isn’t considered feasible. Another big one is that only 20% of houses are affordable for the average American worker, compared to (I think) 63% in 2016. This kind of stuff has led to Millennials not buying material goods like nice furniture because they’re just going to have to leave it behind when they inevitably move to their next rental.
It’s a really multi-layered issue that definitely goes beyond the “the kids are choosing not to buy cars” or “Millenials could afford a house if they’d stop buying avocado toast or Starbucks!” takes that you often see in the news.
Entertainment Things Are cheaper than they were decades ago whereas housing and Health Care are way the fuck more expensive. Back in your day a computer equivalent to an iPhone cost as much as a house whereas today even a basic house cost what a supercomputer did back in 1965


Choosing not to drive then is an incorrect headline whereas unable to afford driving would be more accurate.
Agreed. Moreover, I’d like some more insight in the consumer patterns of Gen Z. A pie chart would be nice including groups like eduction, healthcare, subscription services, entertainment, etc.
I have a feeling, without the data, that a lot of young people are spending way more on novelty and entertainment things than ever before while they’re complaining about not being able to afford things.
IDK why, but this reads like just about what every generation says about a younger generation: bad decisions, worse with money etc.
Even if Gen z were spending a larger percent of their income on luxury items, I’m certain it pales in comparison so their lower average income and higher average housing costs.
I don’t disagree. Which is why I’d like some data.
Your previous comment really reads as “Kids these days can’t afford housing, too busy with their avocado toasts and Netflixes” which is the likely reason for all the downvotes.
I can’t fix people’s narratives. I’m asking for data to illustrate the measurable impact of the economy on people’s personal finance and leisure over the decades.
For one example, to compare 2020 to 1960, what is considered “leisure”, what does that cost, and what percentage of a person’s income is spent on it. I’m not really interested in polls where “Gen Z says they’re struggling to afford a car” because that’s subjective and relative. It’s not at all about questioning their anecdotes; I’m curious what the graph or pie chart looks like over the decades.
I think, and am asking for something to prove me right or wrong simply because I’m curious, that there’s more leisure and luxury available to all people today than ever before. And I feel pretty strongly that the culture of consumerism has grown much stronger over the past 30-50 years making everyone feel like they need to spend more than they were in the first half of the last century.
ProductivityPurchasing Power in The United States peaked in the'70slate '60s.The country’s overall productivity sucks today[see below comments]. I believe the numbers show that we’re all spending more of our income than we ever have before. And for those “earning” a salary based on archaic values set decades ago, it’s certainly logical they’d be most hurt by the culture of consumerism that’s so rampant today.Also, I’d be very interested to compare the graphs to credit card debt over time. It’s too easy to click a button on our phones now to have something charged to a card without the stress of seeing it coming directly out of our checking account. This use of technology, I think, is a real factory for younger people who haven’t grown up learning how to balance a checkbook or the need to save real cash money to make major purchases. The success of services like Mint and Acorn and Chime indicate this isn’t my imagination.
No one likes when someone says your opinion is irrelevant when they’re asking for tangible numbers. I’m well aware that the economy is harder for young adults today. I’m also well aware that most people on the internet are ultra-sensitive and lack reading comprehension. There’s a large segment of the internet that can’t be bothered to read more than headlines and watch ten second TikTok videos. I know younger people aren’t the only ones guilty of this, but I have doubts they’re not the primary culprits.
I really did want to take your comments in good faith but asking for data and then turning around to say something completely and blatantly false (and easily verifiable) is making that hard.
Yeah sure, there’s more leisure-type purchases available to us than ever before, and technology does make transactions ridiculously easy. However, the current economic situation for young adults is much too dire to attribute entirely to individual factors when clearly this is an issue on a societal scale.
Fair enough. This is a version of the chart I’ve seen and had in mind. I suppose the difference is in relation to minimum wage.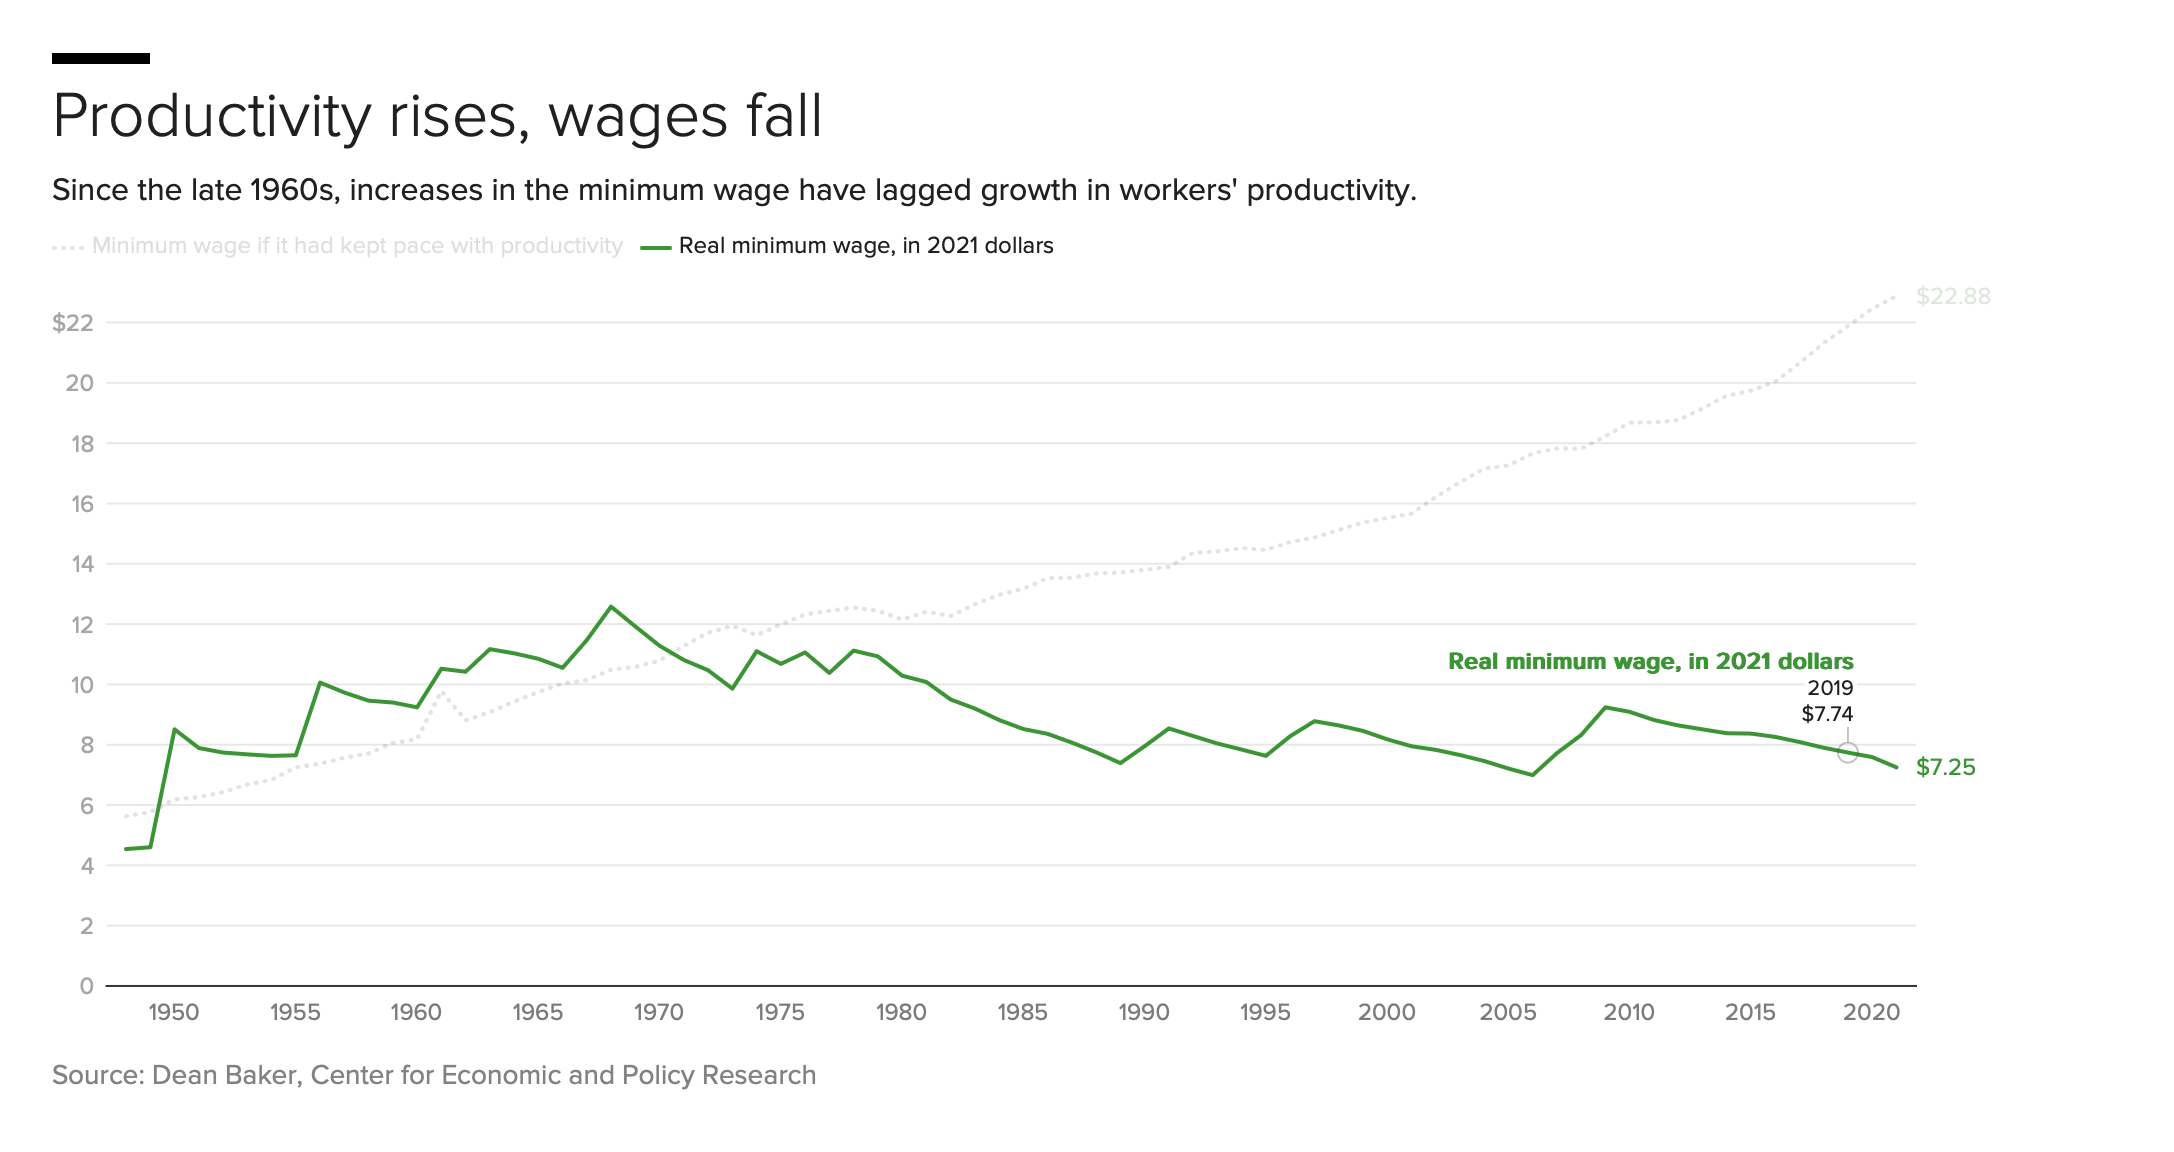
“Purchasing power” is the metric I’ve been thinking about.
Here specifically is the web page I’ve kept in mind when referring to productivity (and I admit that off the top of my head “the 70s” was a bit off).
I concede that “young adults” and “low wage workers” shouldn’t be confused.
I’ve edited my previous comment. Thank you for the point.
I have a hard time understanding how you can present this information (people working harder and longer for less purchasing power than before) and arrive at the conclusion that young adults’ personal spending habits are to blame. The system is clearly engineered to keep the majority poor and enrich a tiny minority.
Want to know where the profits from the increase in productivity went instead of worker’s wages? I suggest looking up CEO wages from the '50s to the present day, and compare with the chart from my previous comment.
Everything I’ve seen has said that Millenials and younger are spending more on experiences and less on things, but also that their purchasing power is much weaker than their parents’ was at the same age. Millenials, I think, have about half the purchasing power as the Baby Boomers did in their 30s and 40s.
Also of note that I just saw the other day is that the price of cars has jumped up about 30% since 2021.
So, not exactly what you’re looking for, but some of the stuff I’ve seen/heard that probably plays contributing factors to this.
I think being priced out of the housing market influences a lot how likely you are to spend your money on experiences. It seems like that’s all young people can afford, the mortgages these days are daunting even for people much older in good positions.
Why buy things when they have to drag them from one flat to another every six months cos of a rent increase or the landlord kicks them out
Good info. Yeah, I’m just curious to see a clear comparison laid out. I think being able to literally visualize it would be more conducive to the ongoing conversation. Tough to trust what one cohort on the internet says about their personal experience. Seems like everyone online is broke yet increasing interest rates tell another story about the market overall.
Yeah, unfortunately, I don’t think one really exists. I’m sure there are people who have done the research, but you’re probably not likely to find the info laid out like that in a major news article or something. There’s also a major generational divide in terms of wealth and a disparity between the rich and poor in the US that’s been described as being comparable to the conditions just before the French Revolution, when a loaf of bread cost the same as the average worker made in a day, so looking at market forces like interest rates and such can paint a very different picture from what the average person is experiencing because of how weighted the averages are by the wealthy.
About a month ago, I watched an unrelated video that happened to have some very well researched info in it on the economic situation of Millenials called The Perpetual Infantilisation of Millennial Women. Great video that I pulled some of the info from for a similar conversation. It’s definitely worth the watch for that info alone. Some of the stuff I remember are things like 43% of Millennials own homes, well below the average of 65% per generation. And of those who don’t own a home, 52% aren’t saving for a house, often citing reasons like poor wages or joblessness, showing that many aren’t buying homes not because they’re buying them later than previous generations, but because for many the idea of owning a home straight up isn’t considered feasible. Another big one is that only 20% of houses are affordable for the average American worker, compared to (I think) 63% in 2016. This kind of stuff has led to Millennials not buying material goods like nice furniture because they’re just going to have to leave it behind when they inevitably move to their next rental.
It’s a really multi-layered issue that definitely goes beyond the “the kids are choosing not to buy cars” or “Millenials could afford a house if they’d stop buying avocado toast or Starbucks!” takes that you often see in the news.
deleted by creator
Entertainment Things Are cheaper than they were decades ago whereas housing and Health Care are way the fuck more expensive. Back in your day a computer equivalent to an iPhone cost as much as a house whereas today even a basic house cost what a supercomputer did back in 1965