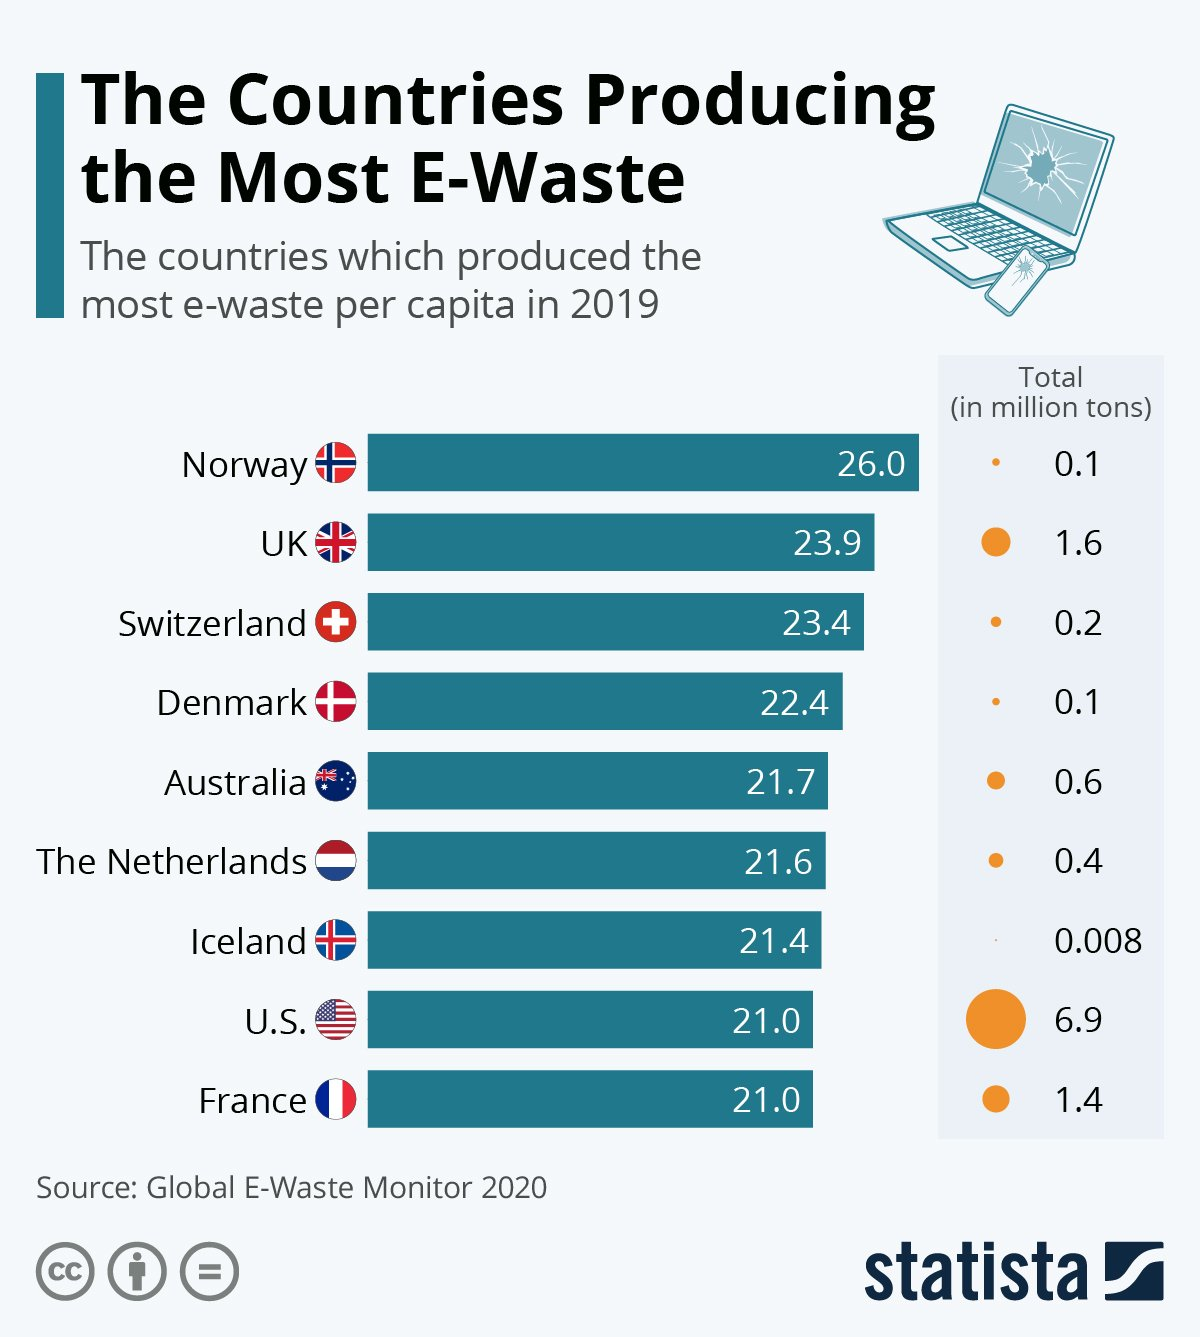
i’m not saying these should be excluded, but rather that the graph should somehow indicate these things
for example, a person X in some country might be buying a 100 gram smarphone every year for ten years and change three gasoline cars in that period, which would result in a kilogram of e-waste, whereas a person Y in some different country could be using a single smartphone for this entire period and a single electric car in that period, which would result in a 2000.1 kilograms of e-waste
this creates a false impression that a person X is less wasteful, i.e. this graph should be adjusted for the sources of e-waste


i’m not saying these should be excluded, but rather that the graph should somehow indicate these things
for example, a person
Xin some country might be buying a 100 gram smarphone every year for ten years and change three gasoline cars in that period, which would result in a kilogram of e-waste, whereas a personYin some different country could be using a single smartphone for this entire period and a single electric car in that period, which would result in a 2000.1 kilograms of e-wastethis creates a false impression that a person
Xis less wasteful, i.e. this graph should be adjusted for the sources of e-waste