

You must log in or register to comment.
How many times did they remix that 42.5% before being like I’m just going to go be a clown?
There pretty much had to be a grad student getting absolutely grilled for crappy measurements when they showed the paper.
“Here are my 6 measurements per datapiont, totalling 240, and here are the 137 measurements for that one spike there”
That is nothing but nature trolling us
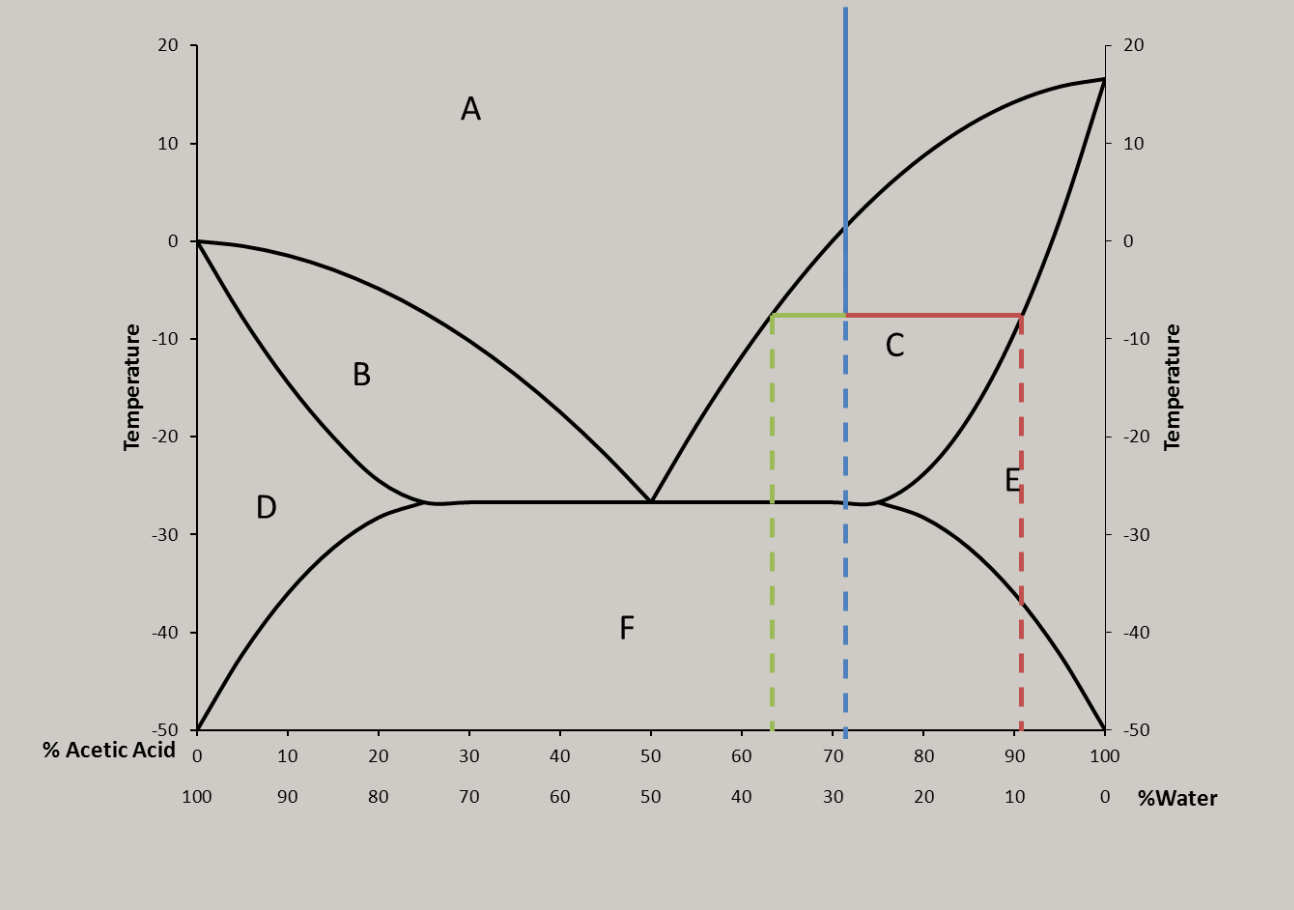
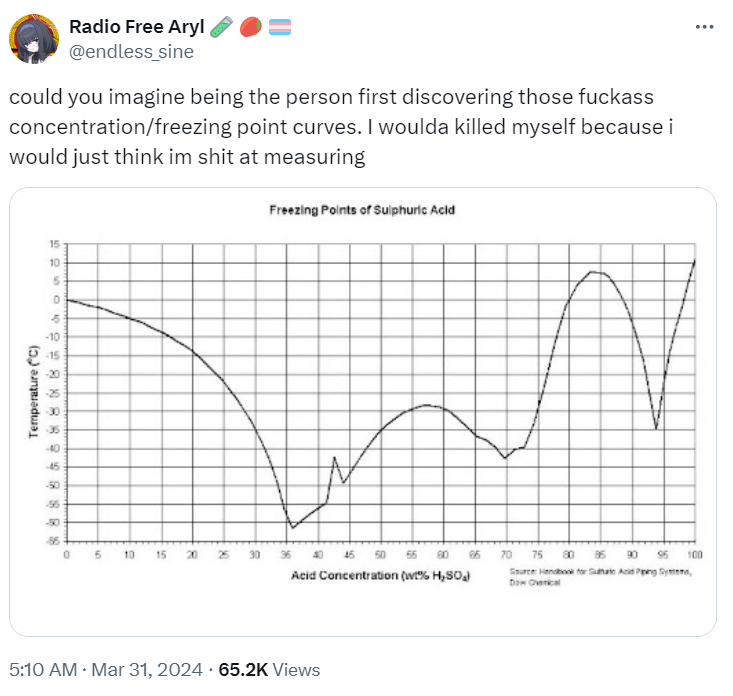
That’s a phase diagram, there’s probably lots of cool things going on in the solid state below that line. Probably different ratio solids at each peak. 1:4 3:2 etc. The % are goofy because it is reported by weight but behaves based on count.
Why it do it like that?
My uneducated gut feeling is that it’s due to the ratio of water and how the water molecules interact with the acid. Other acids have similar curves (in that they aren’t a smooth curve).
This is correct, and it isn’t just associated with acids. It’s because of an effect called ‘freezing point depression’, which is the same reason salt lowers the freezing point of water while raising its boiling point.
There are a few explanations as to why this happens, with the easiest being this: if you add something that can’t freeze to something that can, then the whole thing will need to lose more energy to allow the whole mass to solidify because the un-freezing stuff physically interferes with the attempts of the freezing stuff to bind together.
However, there is also the additional aspect of vapor pressure, which comes into play when adding things that can freeze to another thing that also freezes, but at a different temperature. I don’t really understand that at all, so I will pull from the Wikipedia article on it:
The freezing point is the temperature at which the liquid solvent and solid solvent are at equilibrium, so that their vapor pressures are equal. When a non-volatile solute is added to a volatile liquid solvent, the solution vapour pressure will be lower than that of the pure solvent. As a result, the solid will reach equilibrium with the solution at a lower temperature than with the pure solvent. This explanation in terms of vapor pressure is equivalent to the argument based on chemical potential, since the chemical potential of a vapor is logarithmically related to pressure. All of the colligative properties result from a lowering of the chemical potential of the solvent in the presence of a solute. This lowering is an entropy effect. The greater randomness of the solution (as compared to the pure solvent) acts in opposition to freezing, so that a lower temperature must be reached, over a broader range, before equilibrium between the liquid solution and solid solution phases is achieved. Melting point determinations are commonly exploited in organic chemistry to aid in identifying substances and to ascertain their purity.
So, TL;DR is that chemistry is weird, things react weird at the molecular level because of energy states, and that is what allows us to make ice cream!
Thanks for the extra info. I figured it applied across many solutions. And your TLDR was my initial response - chemistry…well physics in general to cover everything else too, is weird.
The particular acid (sulfuric acid) in the graph is especially complicated b/c it has three different protonation states that are favored at different pHs. Other acids (like nitric, for example) at least only have two protonation states to worry about…
molecules be getting freaky with it fr fr
And that’s at fixed pressure, otherwise the graph turns 3D and whoever has to format it starts looking longingly at the window
And then we have fluids with multiple substances and you might need higher dimensions
Better is Acetic acid
Water itself is also fine. In space what ocurres with water? Does it freeze or evaporate?
In space what ocurres with water? Does it freeze or evaporate?

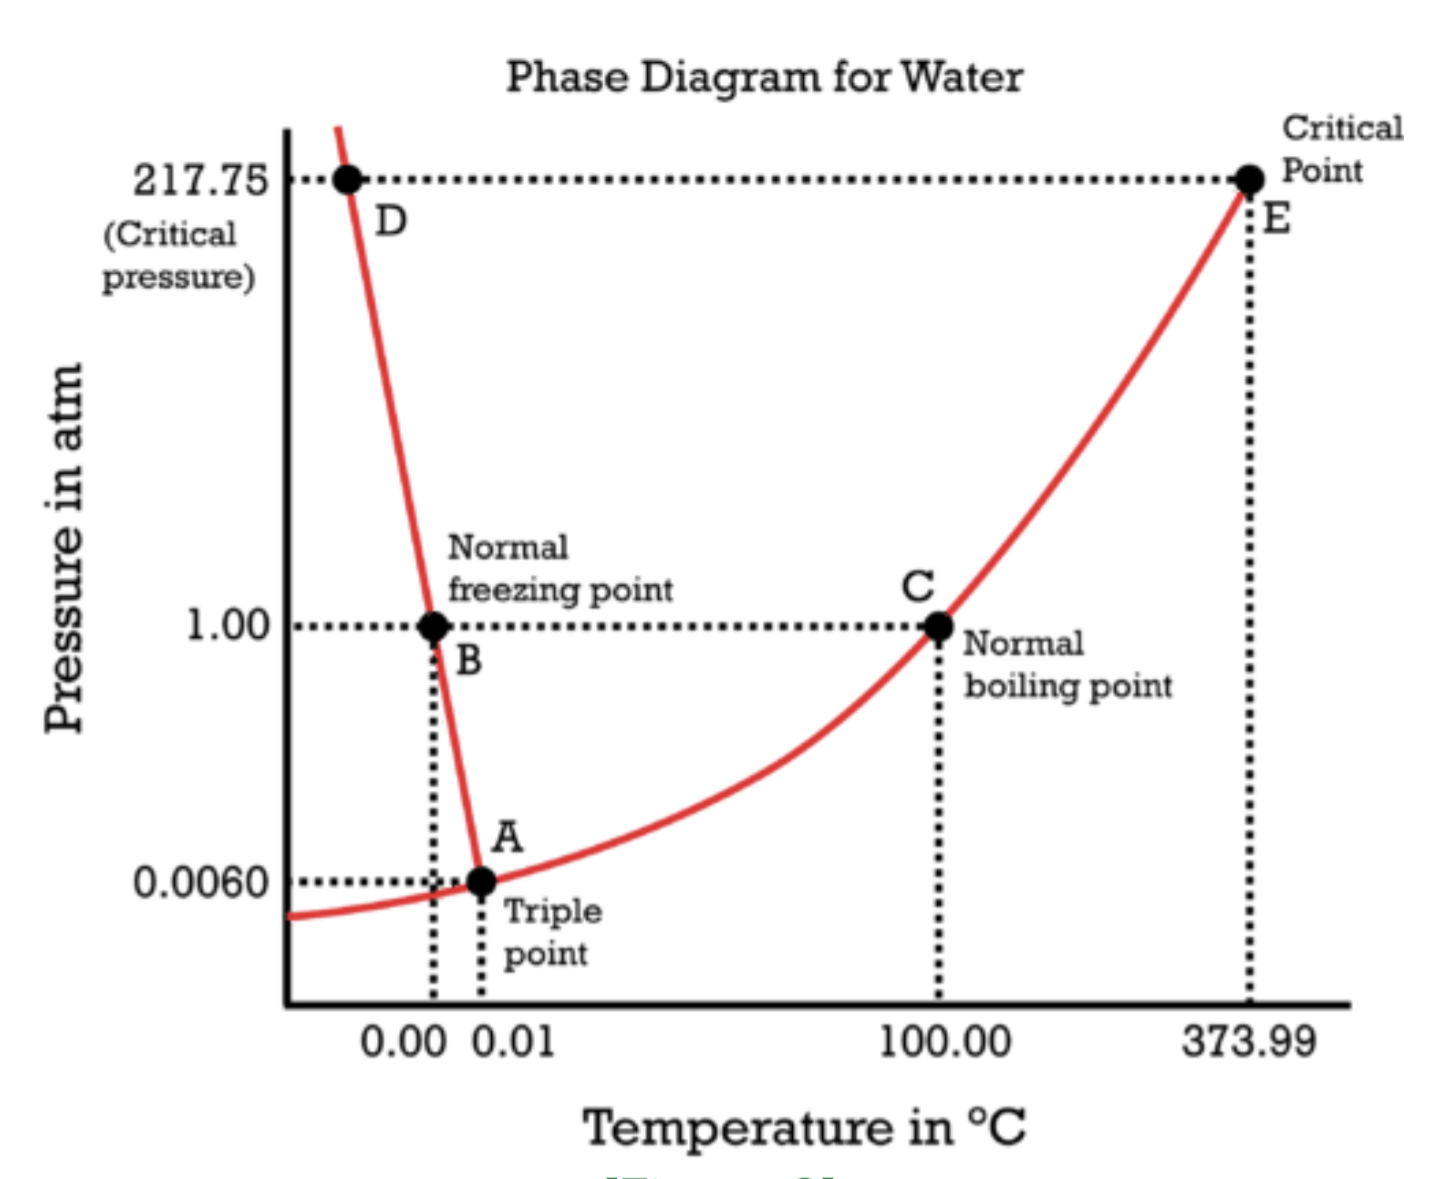
Depends on temperature and pressure. This diagram doesn’t go that low, but I would guess it’s a solid in the near vacuum of space based on what I know of space ice like Saturns rings and comet tails.
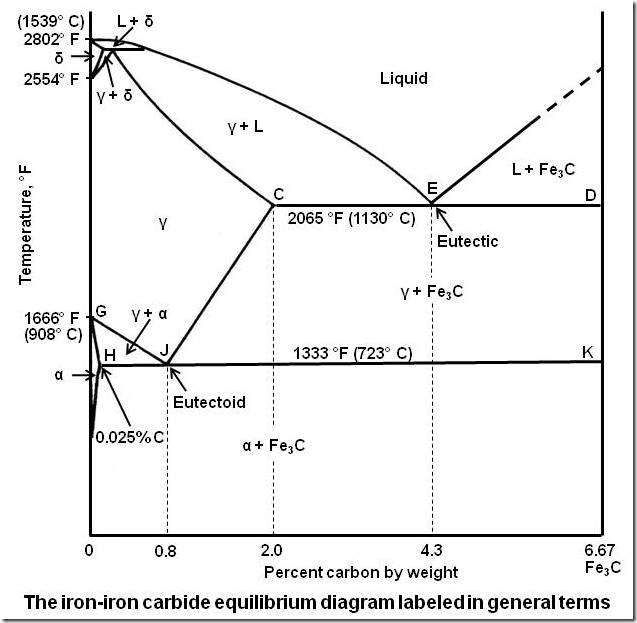
Yes, Water itself has a pretty weird freezing diagram, but meltin diagrams are already weird, even in metals as I remeber this from Iron, iron carbid. Melting always depends on several factors, pressure, depending of added substances…
Depends on how far out it is from the nearest star. Inside the orbit of jupiter exposed ice will sublimate into steam thanks to heating from sunlight, outside it remains ice. This is actually what a comet is, namely a ball of ice from the outer solar system orbiting in close to the sun and sublimating off. The steam is so loosely bound thanks to the tiny gravity of the comet that the solar wind blows it away, creating the visable tail.
That’s just the tip an apple. Don’t you dare try to tell me otherwise.
Imagine this, but with a sample set that can’t be easily replicated and no one believes that you didn’t doctor them somehow. Not fun.
That’s a phase diagram, there’s probably lots of cool things going on in the solid state below that line. Probably different ratio solids at each peak. 1:4 3:2 etc. The % are goofy because it is reported by weight but behaves based on count.
Is this what the audiophiles call “w shaped?”
This is what audiophiles call “wtf is this FR curve.”
Does the fr curve just reply back with: bonjour?
No, it replies with tinnitus-inducing screeches :)
Is there any way for me to easily download this waveform?
I think it’s the bass line from that one Daft Punk song…
This sounds like a fun project “samples of chemistry”
I’d love to throw it in a wavetable synth*
I would only trust the 0%…


