
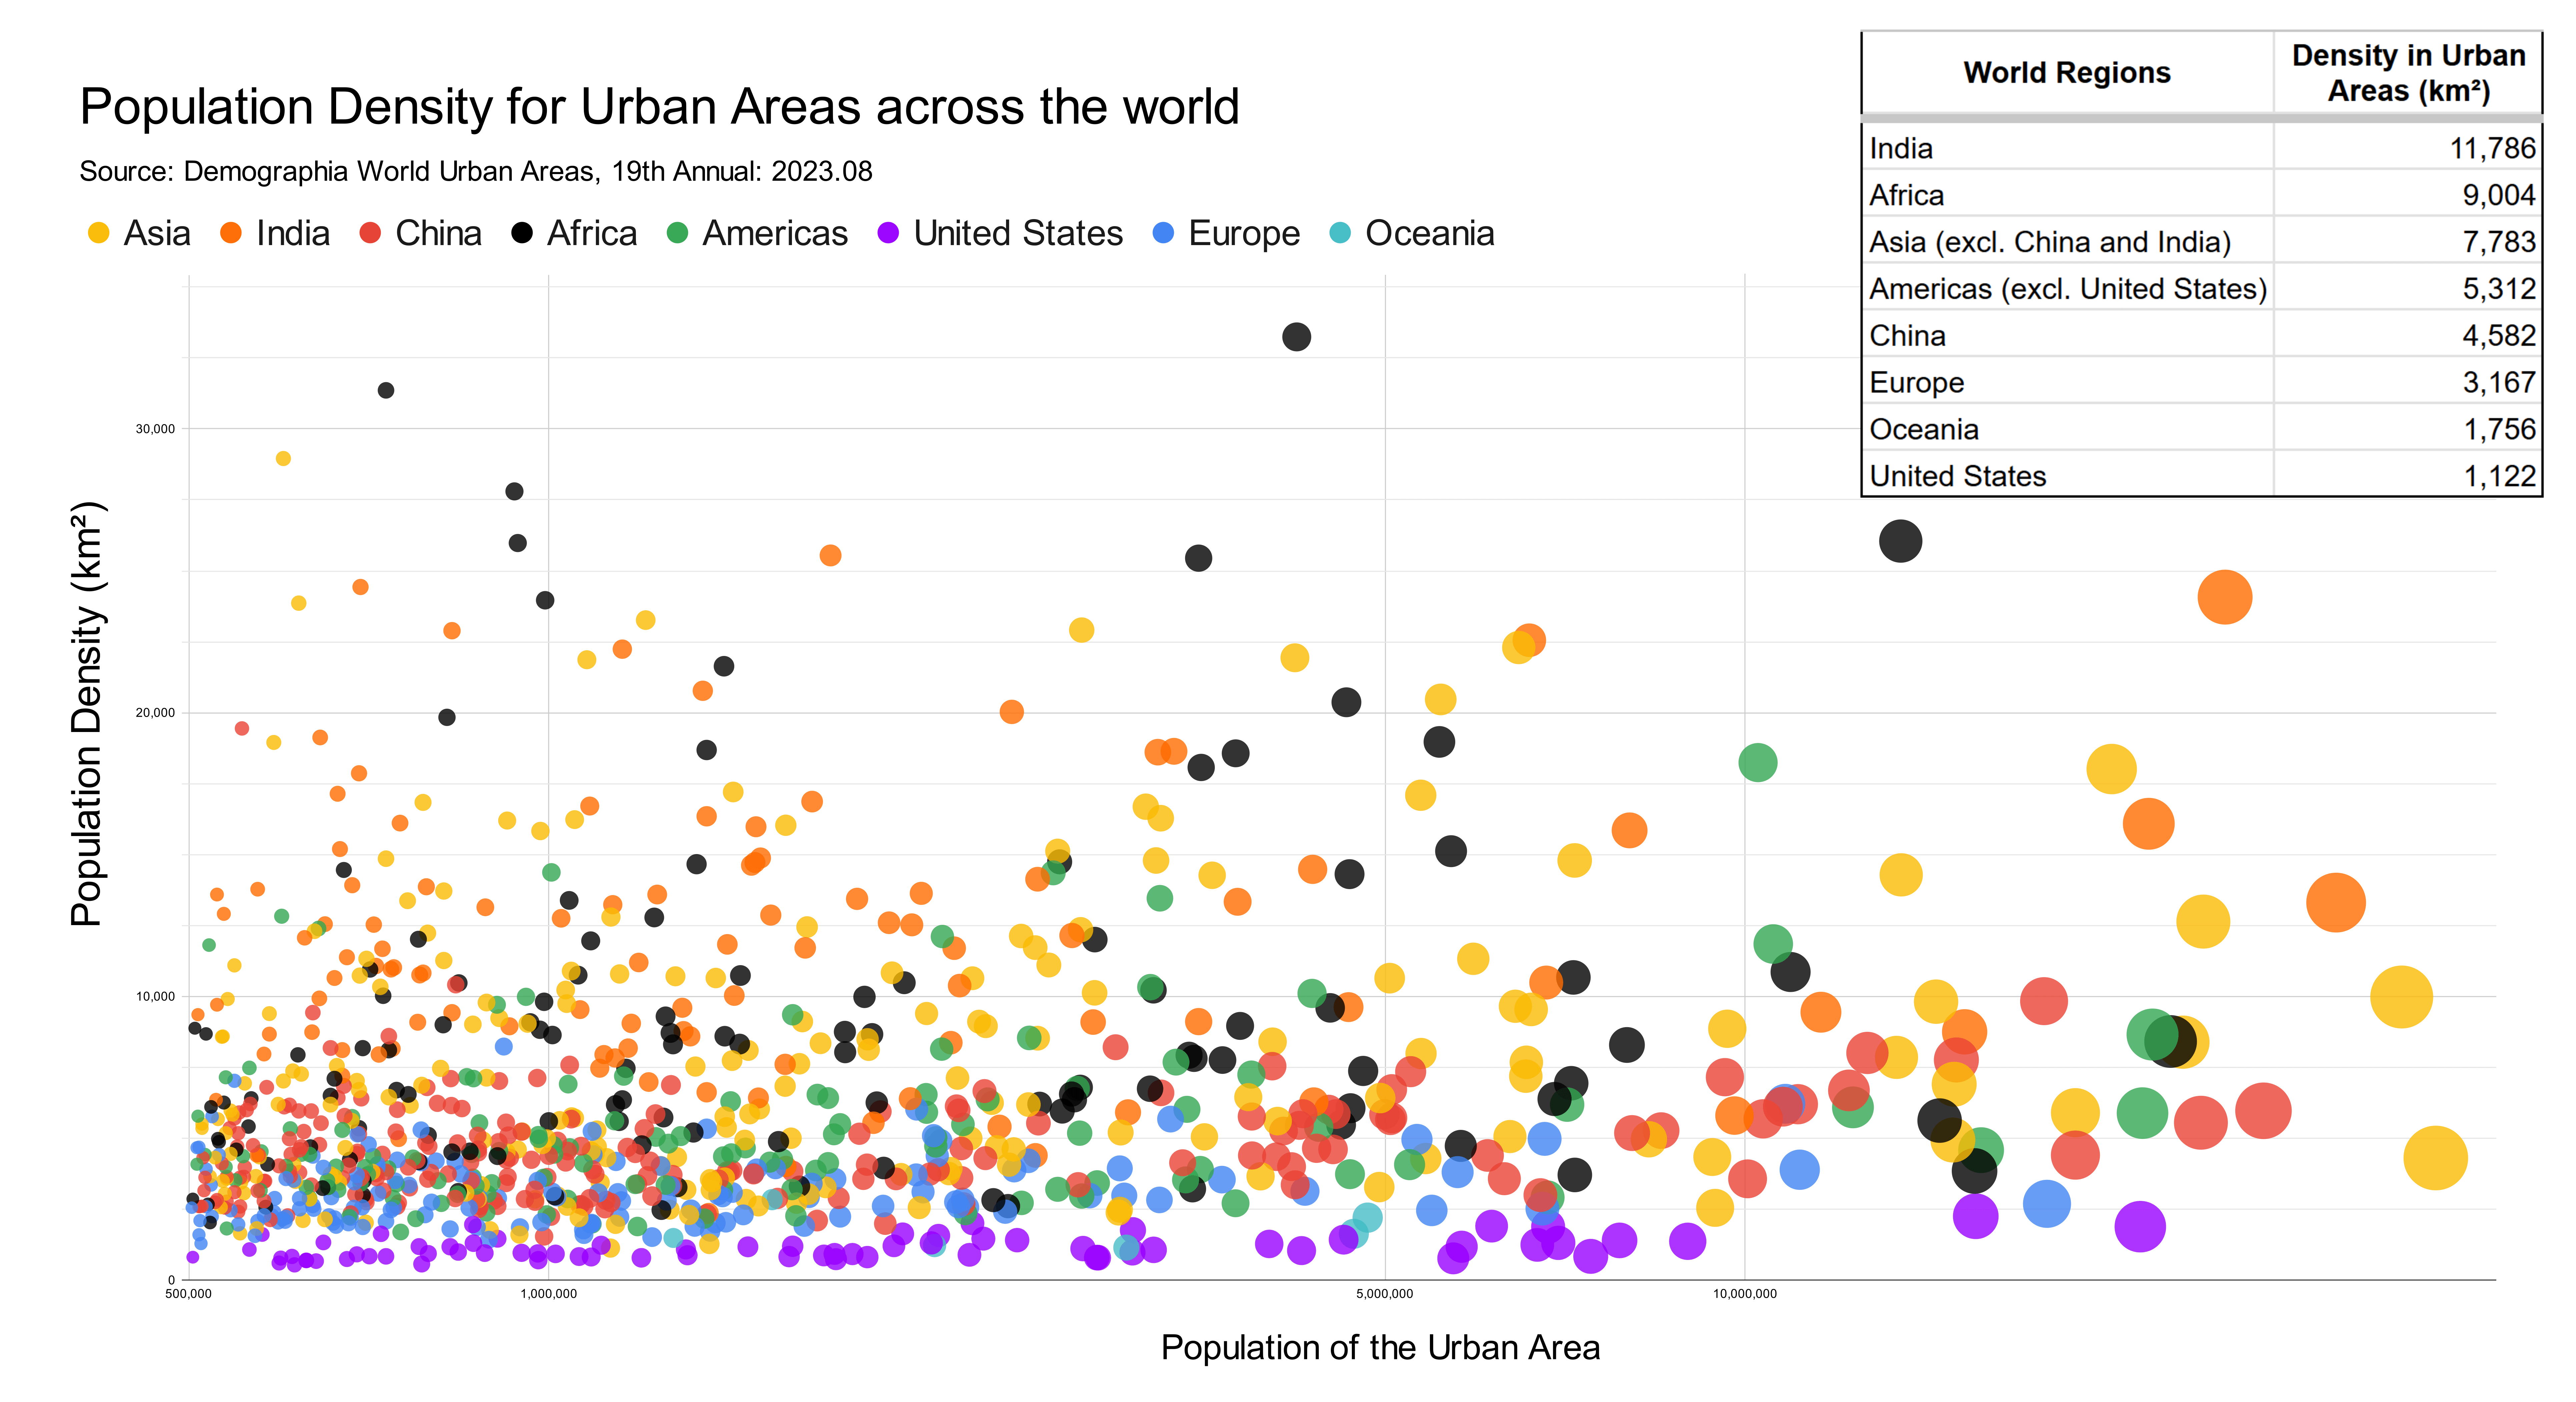
My chart shows population density in all urban areas that have over half a million people. “Urban area” basically means the built up area in and around a city, including its suburbs. The chart would be way too busy if it included labels for each city, so instead I opted to group them by the part of the world they are located in. This shows the striking difference in urban density across different parts of the world.
My data source for both population and population density came from Demographia World Urban Areas, 19th Annual: 2023.08_. This is a regularly updated collection of statistics for urban areas that include population and land area. I made this chart using Google Sheets and edited it with Inkscape.
If you’re interested in diving deeper into this data, I put together a spreadsheet of the data and a detailed version of the map with city labels (which is still very cluttered). Enjoy!
Huh. I hadn’t really thought about it before, but it would seem to indicate that size and density are mostly independent parameters of a city.