lnxtx (xe/xem/xyr)@feddit.nl to 196@lemmy.blahaj.zoneEnglish · 2 months agoVal(r)u(l)efeddit.nlimagemessage-square17fedilinkarrow-up1112arrow-down18
arrow-up1104arrow-down1imageVal(r)u(l)efeddit.nllnxtx (xe/xem/xyr)@feddit.nl to 196@lemmy.blahaj.zoneEnglish · 2 months agomessage-square17fedilink
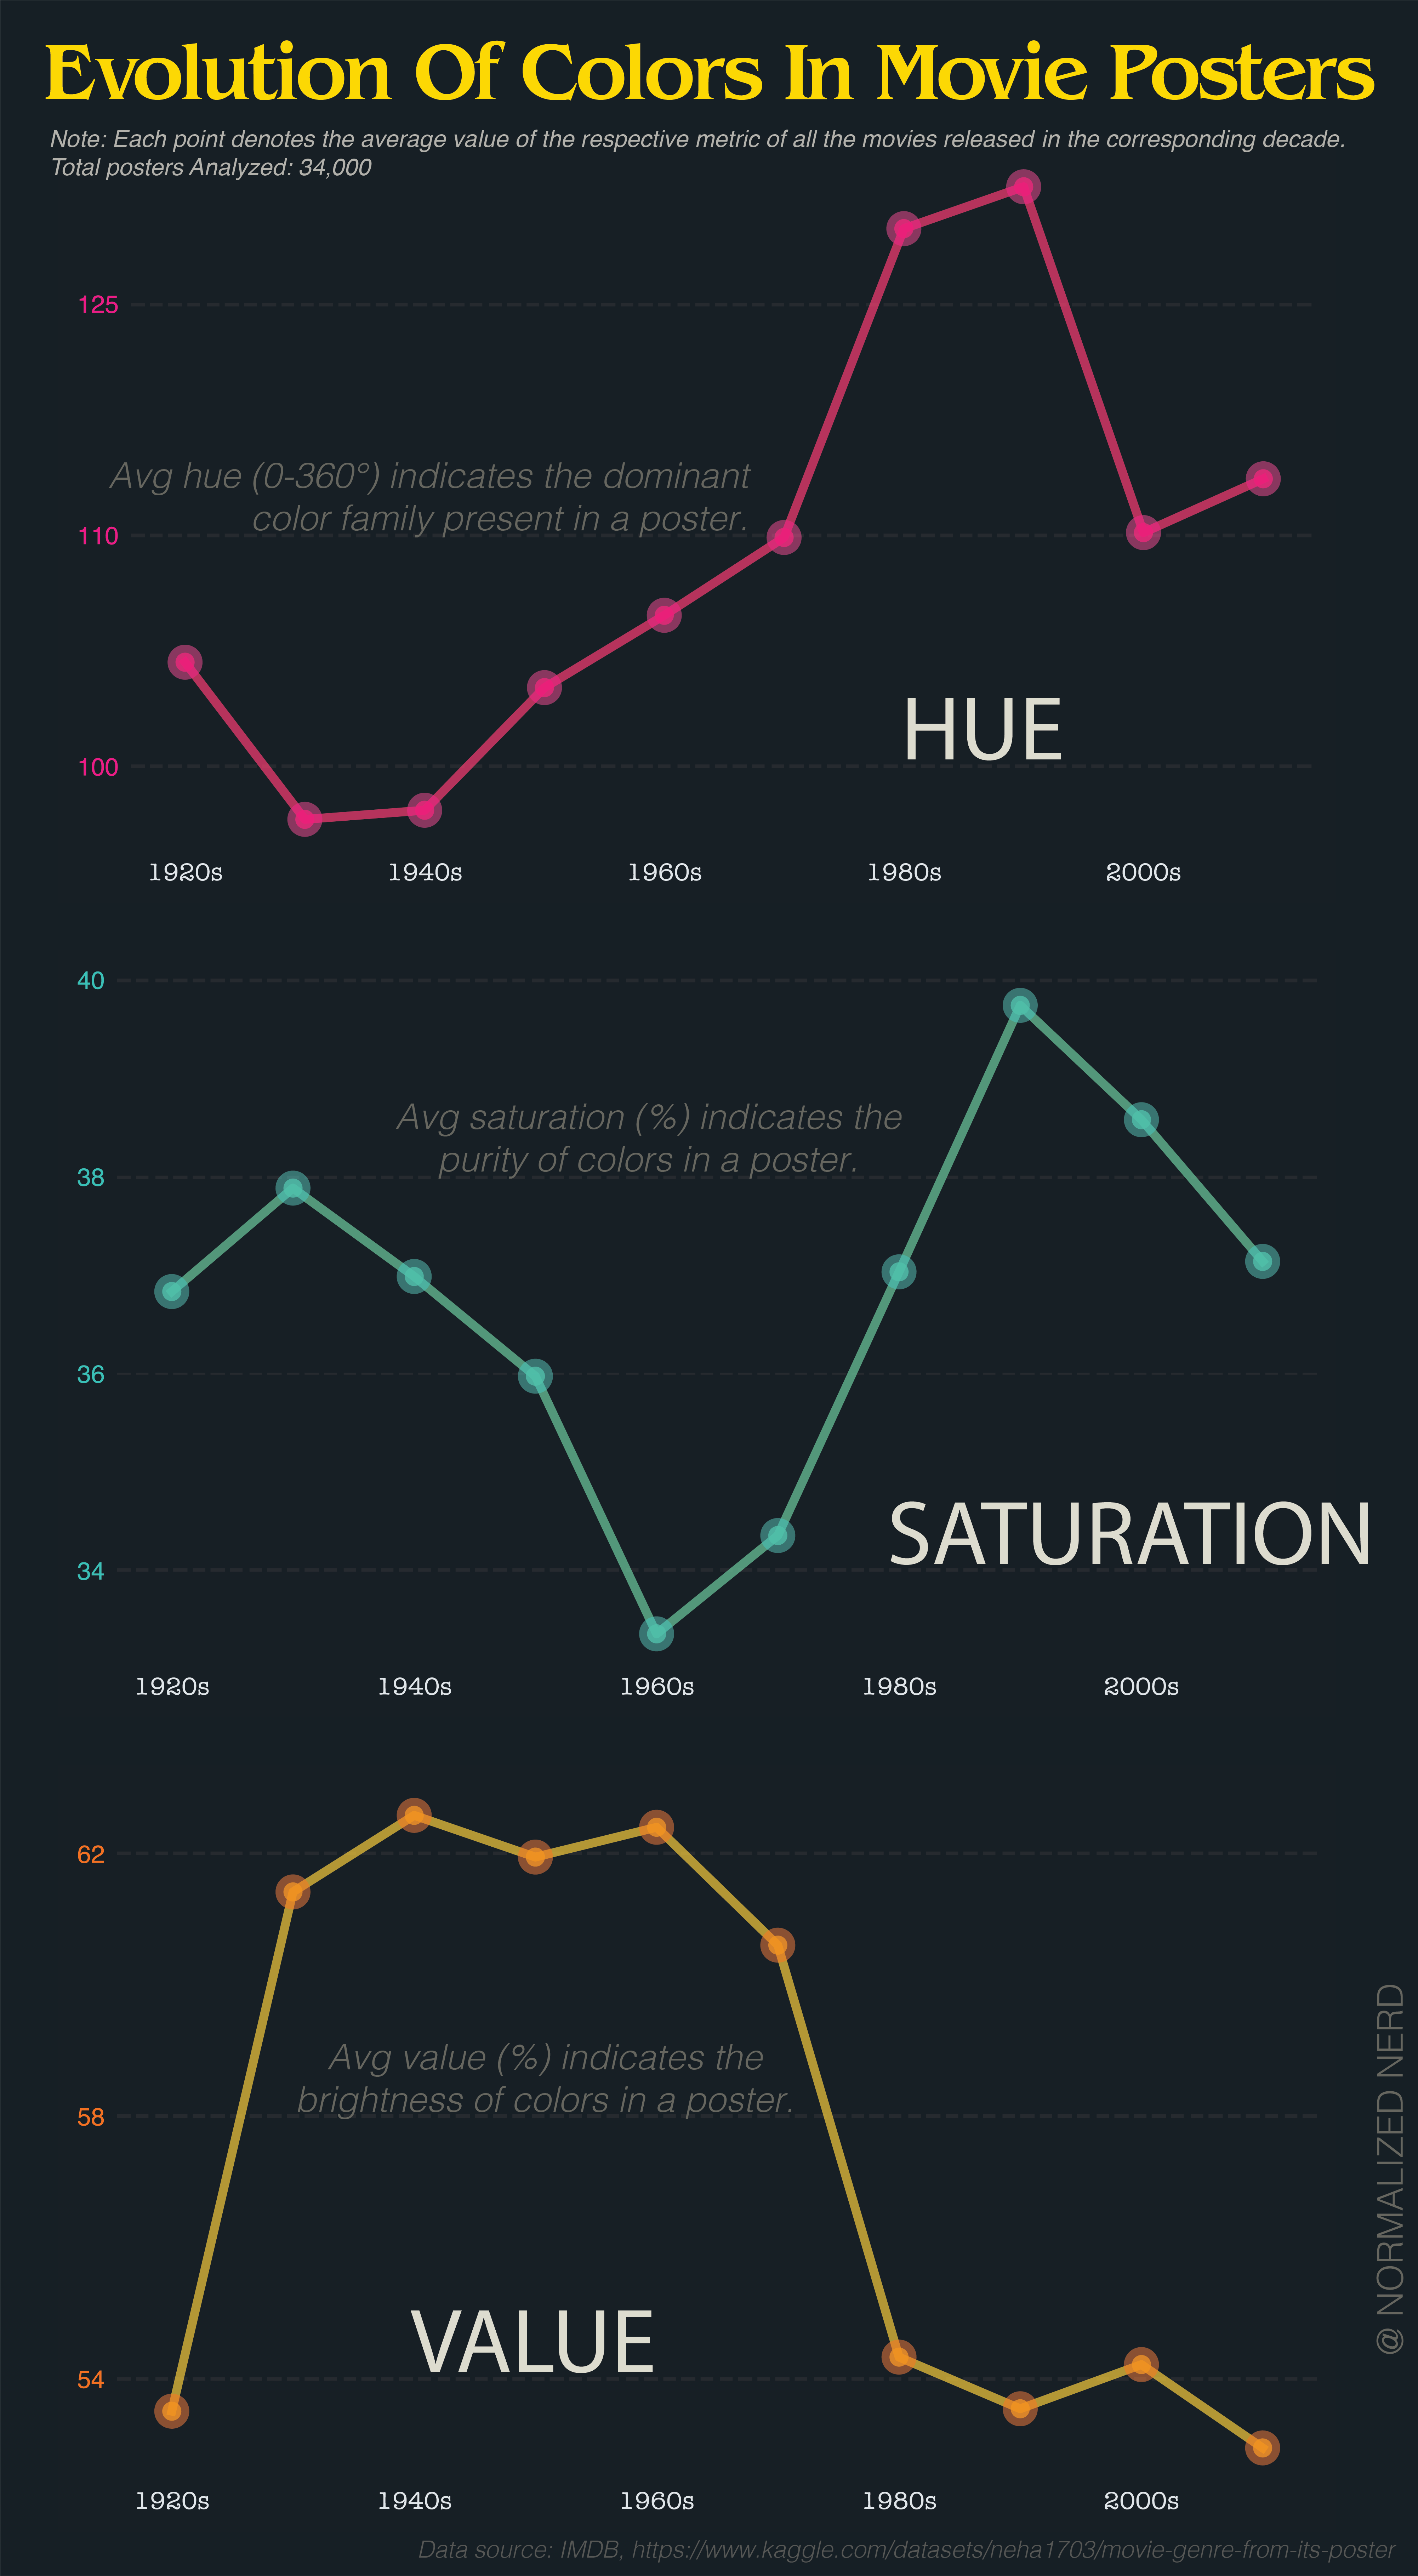
minus-squareStarbuncle@lemmy.calinkfedilinkEnglisharrow-up2·2 months agoIt would have made more sense if they had shown the distribution of hue as a polar graph and just had one every decade to show how it changes over time.


It would have made more sense if they had shown the distribution of hue as a polar graph and just had one every decade to show how it changes over time.