Source (restricted to non-HBO-Max regions)
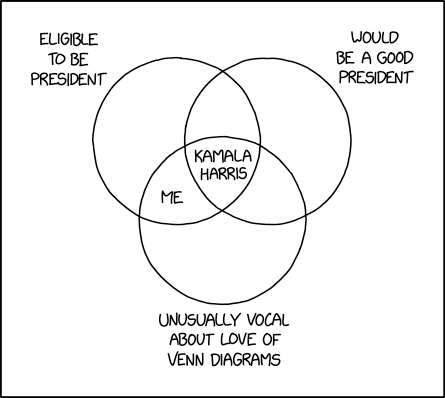
Kamala Harris is known to love Venn diagrams and would be cringing hard at this.
For reference, circles in Venn (Euler) diagrams are sets of objects with a certain property. Select objects are shown inside or outside of each circle depending on whether they belong to the set.
A good example is xkcd 2962:


Guess this is the difference between chart removed and diagram enjoyers.
Chart removed be like: “The y-axis does not start at 0! Misleading!”
Diagram enjoyers be like: “It mathematically cannot because it’s a logarithmic scale, which is the only way this data can be reasonably visualized; but I suppose they should have made the y-labels bigger and add minor horizontal gridlines so even people like you notice that.”