
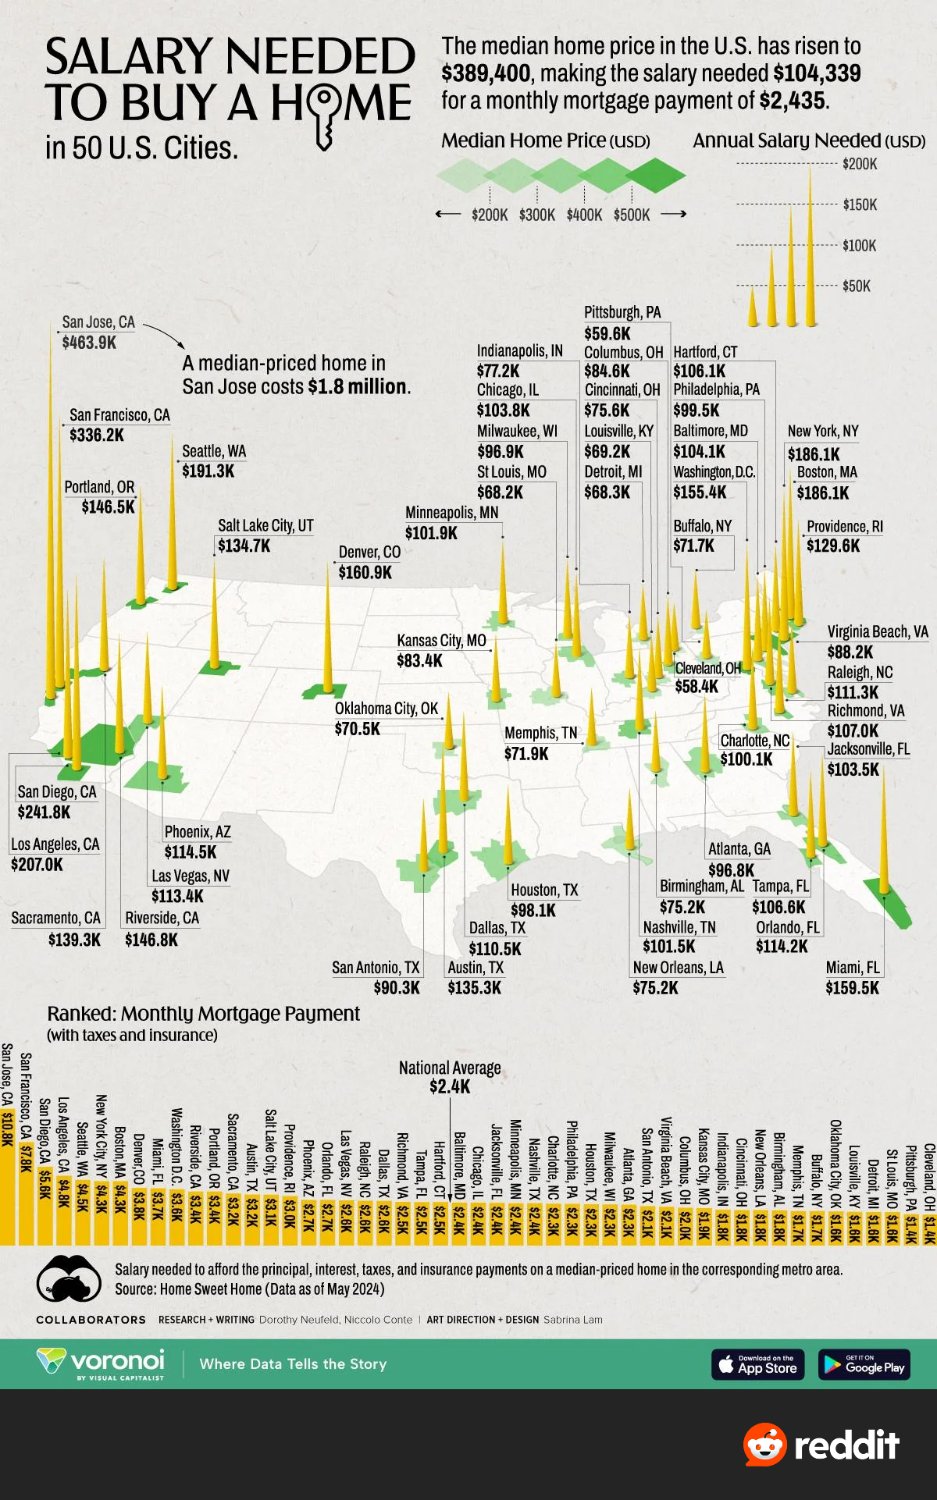
I have family that lives in San Jose and this is a common topic of conversation at family gatherings.
Everyone that bought houses got them years (and decades) ago, before all this insanity. On paper, their property values have gone up, but so have their property taxes. Those who locked in their mortgages at fixed rates at least aren’t seeing their monthly payments go up, but those who took out HELOCs to fix something up have watched the payments multiply.
If they sell, they’re worried a big chunk will be taken out for capital gains and they will have to move far away or even out of state for what they could afford. Those with college age kids worry that their kids will never be able to live near them (so they can see their grandkids). And those retired on fixed income are watching as property taxes and high local inflation chips away at their savings.
It’s a strange quandary. Doesn’t seem sustainable.
I wonder how the cities were picked. I was curious about NJ, but it didn’t make the list. You got everyone else around it, though, and PA and NY get 2 cities on here.
And a lot of states not represented at all. I guess they’re affordable and don’t fit the narrative. I’m not trying to say that housing prices are not too high, but using cherry picked data looks bad no matter which side of the argument you’re on.
That’s why I am shocked NJ wasn’t on here. It fits into the narrative, if that’s what they were trying for. It’s going to be one of the highest places to live.
It’s strange that it lists Salary instead of Household Income. I’d be curious to see a comparison of the average home cost vs average household income, as that would paint a clearer picture of affordability.