From personal experience, I know Lemmy.ml, Beehaw.org, Lemmy.world are performing very badly. So far, I have not been able to convince any of hese big server operators to share in bulk their lemmy_server logging as to what is going on.
Tuning and testing is difficult because 1) the less data you have, the faster Lemmy becomes. The big servers have accumulated more data. 2) the less federation activity you have, the less likely you are to run into resource limits and timeout values. These big servers have large numbers of peer servers subscribing to communities.
Nevertheless, we need to do everything we can to try and help the project as a whole.
HTTP and Database Parameters
const FETCH_LIMIT_DEFAULT: i64 = 10;
pub const FETCH_LIMIT_MAX: i64 = 50;
const POOL_TIMEOUT: Option<Duration> = Some(Duration::from_secs(5));
https://github.com/LemmyNet/lemmy/blob/0f91759e4d1f7092ae23302ccb6426250a07dab2/src/lib.rs#L39
/// Max timeout for http requests
pub(crate) const REQWEST_TIMEOUT: Duration = Duration::from_secs(10);
See also that Lemmy Rust code has a 5-second default PostgreSQL connection timeout for pooling, and default of 5 pool instances. https://github.com/LemmyNet/lemmy/issues/3394
lemmy_server behavior
Exactly what gets logged in the Rust code if these values are too low? Can we run a less-important (testing) server with these values set to just 1 and look at what is being logged so we can notify server operators what to grep the logs for?
What are the symptoms?
What can we do to notify server operators that this is happening? Obviously a database resource suggests that using a database table to increase an error count might run into problems under heavy load. Can we have a connection to the database server with higher timeouts and a dedicated table (with no locks) outside the connection pool and have the error logic set a timestamp and count of when these resource limits are being hit in production?
following as I think (unverified) that some.of the current jerboa symptoms (specifcially crashes) may be a result of the app mishandling malformed API responses due to server overload.
quick update on this. have been playng with the jerboa v0.0.36 fdroid build and it seems to handle network errors and junk data in a much more sane way - still not ideal, but we now get error notifications instead of an outright crash.
looks like the jerboa robustness issue is slowly being addressed.
What are the symptoms?
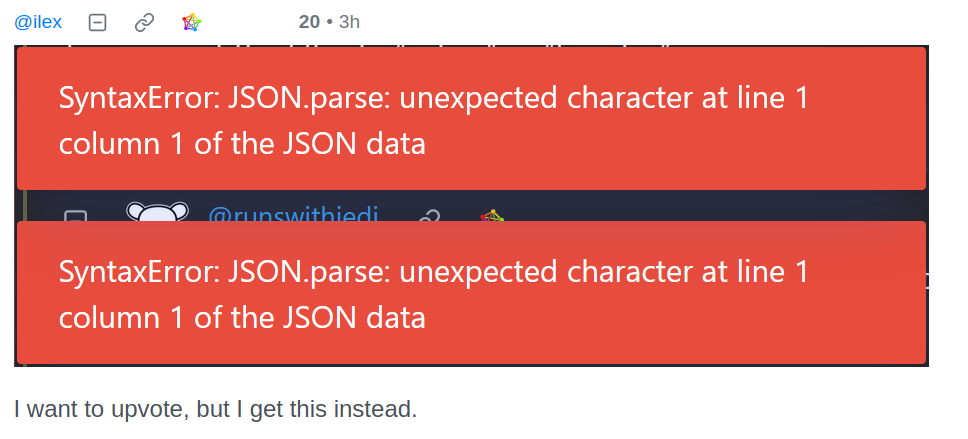
Lemmy.world was upgraded to 0.18.1-rc1 today, and a user reported this problem with an upvote failing:

I’ve seen several JSON parsing problems because a raw message is returned “Timeout”, and is that the PostgreSQL polling timeout? There is an open bug about not getting errors because the Lemmy API doesn’t return JSON on many error paths: https://github.com/LemmyNet/lemmy/issues/3366
same here. I have seen multiple examples of bad responses bubbling up through the lemmy web front end. anecdotally, these seem to come in clusters (server overload?) and seem to coincide with increased abends on the jerboa app.
if all of this is is related – and it looks more and more like it – then the underlying server side API response inconsistencies have to be resolved and any clients must handle error conditions (includng junk data and non-responses) in a sane manner.
DB performance is obciously pretty damn important for scaling and will be part and parcel of the solution, but inconsistency of API operation is a pretty fundamental issue that must (and I am sure will) get worked out.
in the meantime, lemmy client devs get free(!) servers (production no less!) to test their client error handling against :-p
Another code value to get some tuning/behavior references on:
pub const FEDERATION_HTTP_FETCH_LIMIT: u32 = 50;2 days ago someone pointed out what has been driving me crazy… the Rust code looks “clean” and direct, because so many error conditions are outright ignored. Database not responding, etc, is not represented in the code.

