

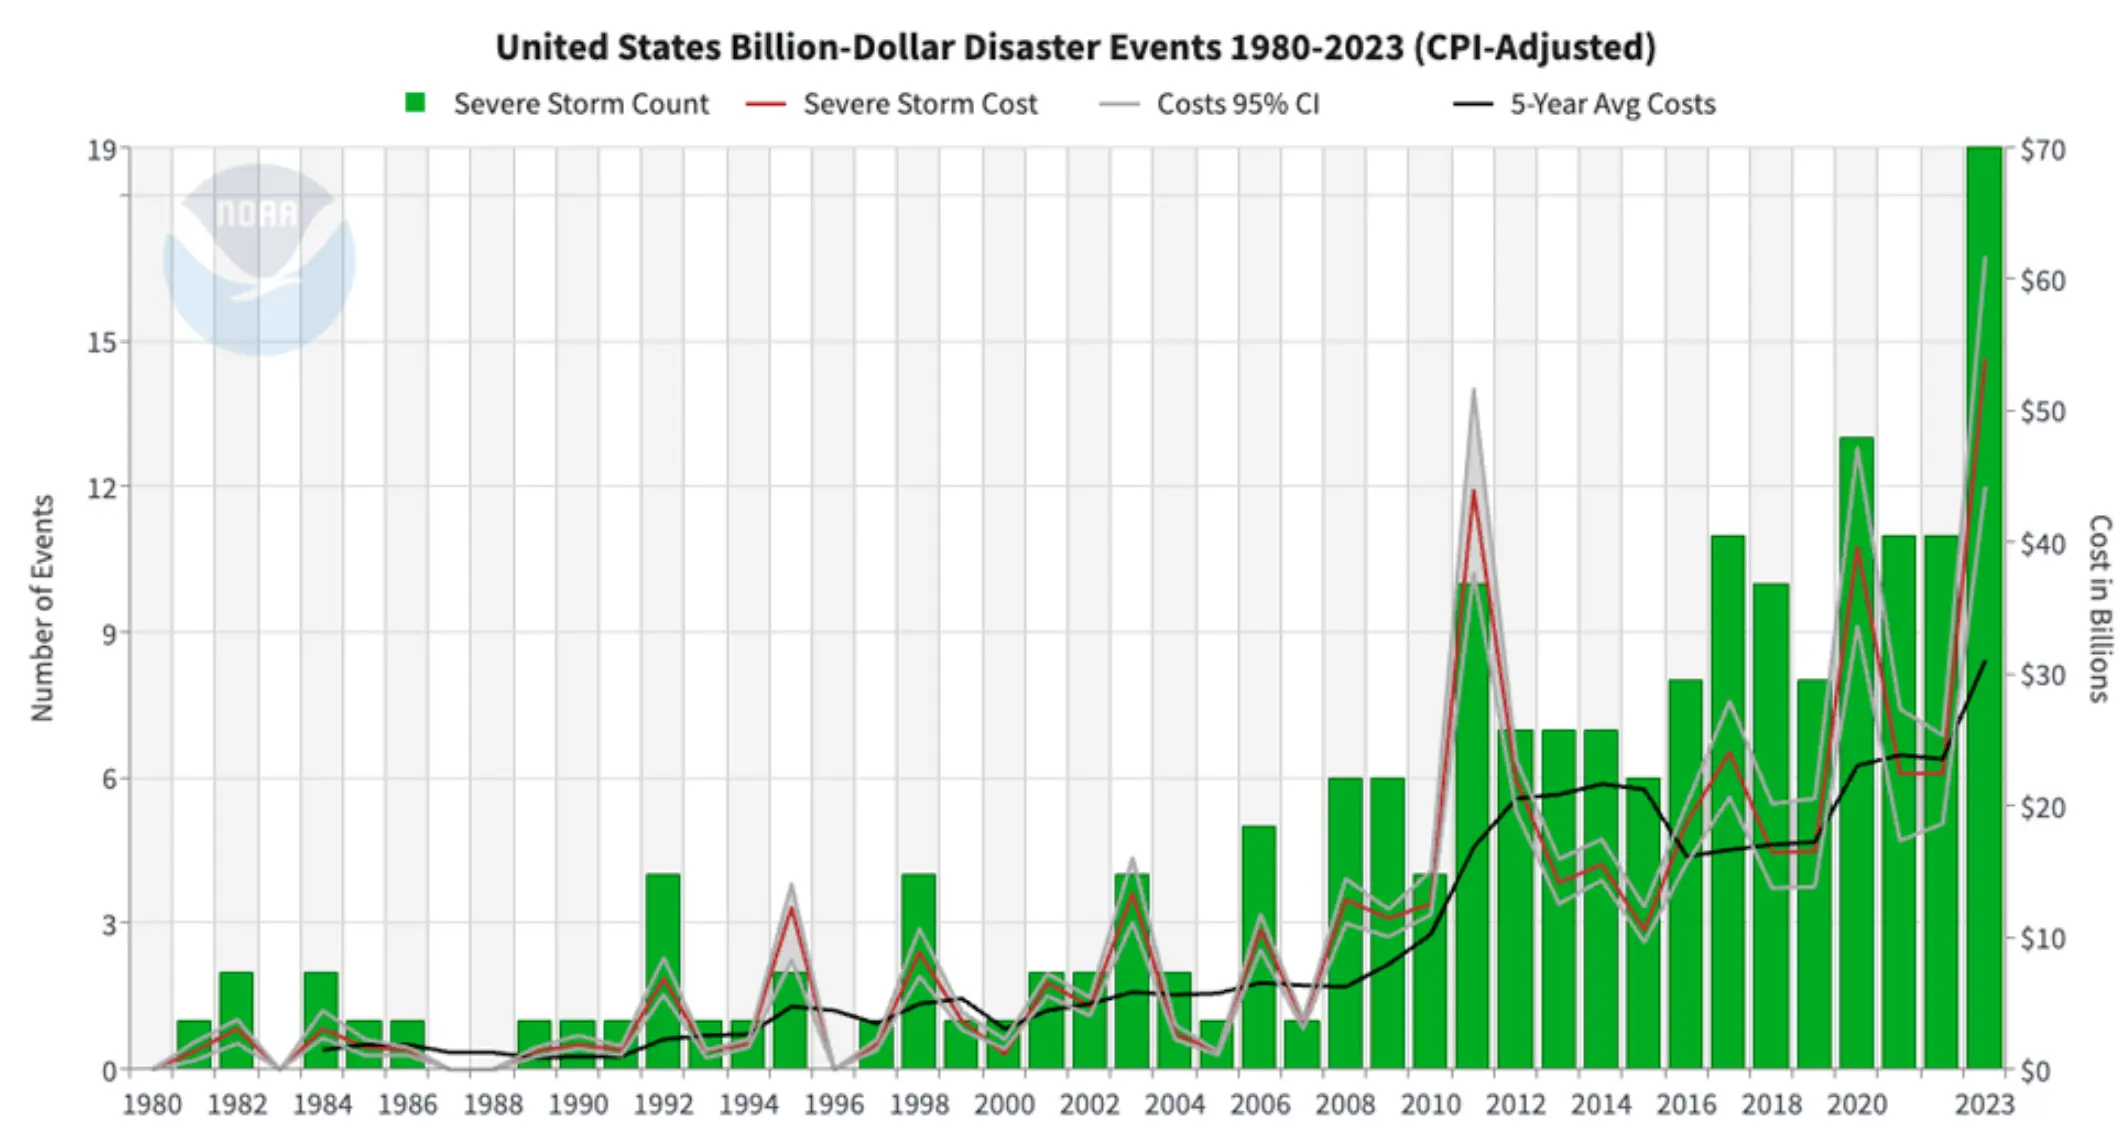
The CPI adjustment in this graph means that it’s using inflation-adjusted dollars, so that you can accurately compare financial impact across distant time periods.
The CPI adjustment in this graph means that it’s using inflation-adjusted dollars, so that you can accurately compare financial impact across distant time periods.
Interesting that it’s only the fifth hottest year for the US. I guess, they have a lot of land mass far away from the oceans, so El Niño can’t heat them as directly…